


Ghost in the Ring: Detecting io_uring & eBPF Kernel Rootkits When kprobes and Syscall Tables Lie
For the past decade, Linux Endpoint Detection and Response (EDR) agents and runtime security monitors (Falco, auditd, legacy tracepoint/raw_syscalls/sys_enter sensors) have relied on a single foundational assumption: every meaningful interaction between a userspace process and the outside world must cross the syscall instruction boundary with inspectable register arguments.
In 2026, two native Linux kernel subsystems have shattered that assumption for offensive implant and rootkit authors:
io_uringAsynchronous Ring Buffers (IORING_SETUP_SQPOLL&io-wq): Once a process callsio_uring_setup(2)andmmap()s the Submission Queue (SQ) and Completion Queue (CQ) rings into shared memory, it can open sensitive files, spawn network sockets, connect to C2 servers, and exfiltrate credentials using zero system calls—writing Submission Queue Entries (SQEs) in userspace RAM while a Ring-0 kernel thread (iou-sqp-<pid>) polls and executes them directly.- Self-Hiding Offensive eBPF Rootkits (
bpf_probe_write_user,fexit, &XDP): When an attacker achievesCAP_BPF+CAP_PERFMON(orroot), they no longer load noisy, unsigned.kokernel modules (insmod) that trip module-signature enforcement. Instead, they load verified eBPF programs attached tofexit/__x64_sys_getdents64,fexit/__x64_sys_bpf, or NICXDPrings that mutate userspace return buffers on the fly—hiding rogue PIDs fromps, concealing C2 packets fromtcpdump, and spoofingbpftool prog showso the eBPF rootkit hides its own program ID.
Here is the kernel-level playbook for hunting both classes of “Ghost in the Ring” implants using io_uring tracepoints, out-of-band /proc/kcore prog_idr XArray walking (drgn), Silicon Hardware PMU Last Branch Records (Intel LBR), and immutable BPF_LSM gates.
1. Anatomy of an io_uring Syscall-Less Implant (Curing / RingReaper)
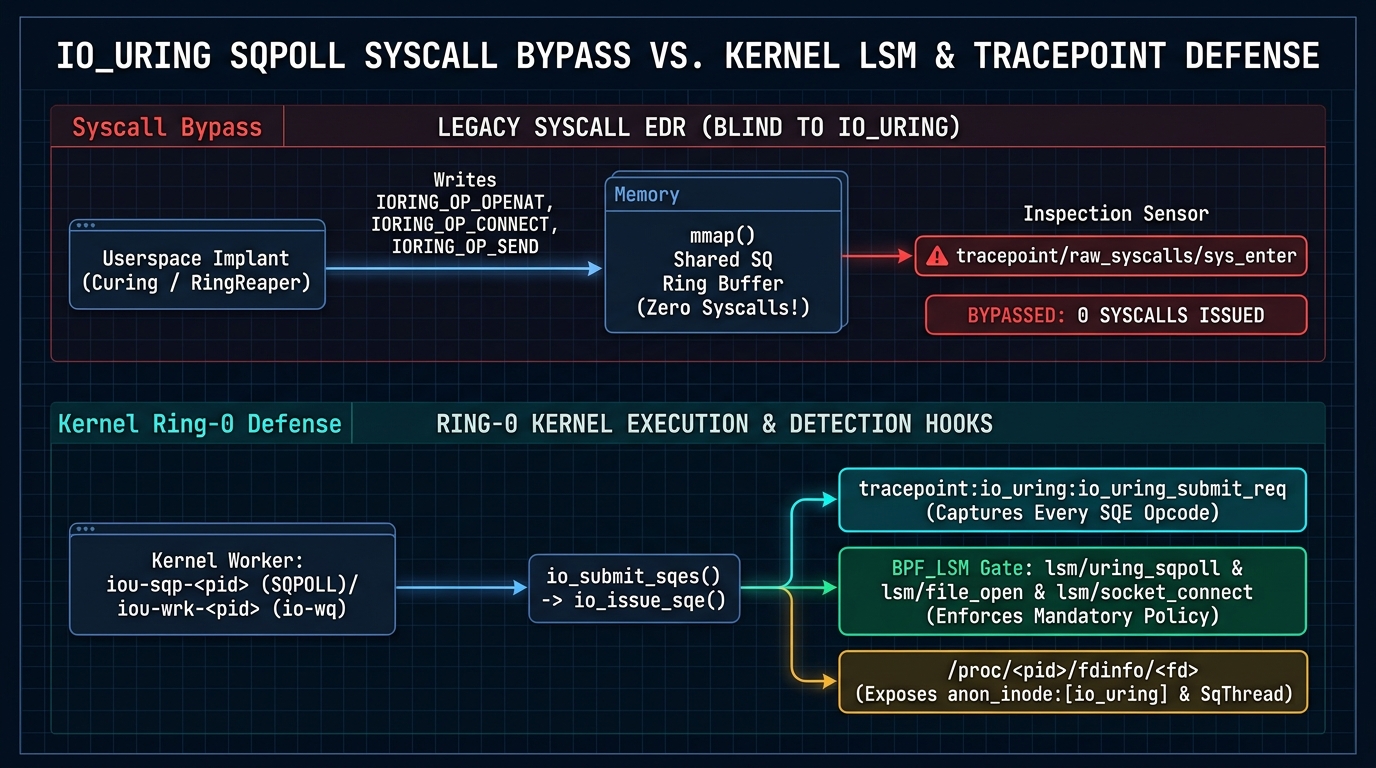
Why do auditd, strace, and tracepoint/raw_syscalls/sys_enter sensors miss io_uring activity completely?
Look at the two execution paths inside io_uring/io_uring.c:
- Multiplexed Async Workers (
io-wq/iou-wrk-<pid>): Even if an implant callsio_uring_enter(fd, to_submit, min_complete, flags, sig), the syscall registers (%rdi..%r8) contain zero file paths, socket structs, or buffer pointers. The actual I/O opcodes (IORING_OP_OPENAT,IORING_OP_SOCKET,IORING_OP_CONNECT,IORING_OP_SEND,IORING_OP_SPLICE,IORING_OP_URING_CMD) sit insidestruct io_uring_sqedescriptors in sharedmmap()pages, drained asynchronously by kernelio-wqworker threads (iou-wrk-<pid>). - True Zero-Syscall Mode (
IORING_SETUP_SQPOLL/iou-sqp-<pid>): When initialized withIORING_SETUP_SQPOLL, the kernel spawns a dedicated Ring-0 polling thread (io_sq_thread()) that busy-polls the shared userspaceSQhead/tail pointers. The implant can run for months executing file reads and C2 network socket operations while its syscall counter remains completely frozen at zero!
+-------------------------------------------------------------------------------+
|          WHY SYSCALL TELEMETRY MISSES IO_URING + SQPOLL IMPLANTS              |
+-------------------------------------------------------------------------------+
|                                                                               |
|  [ Standard Process ]                                                         |
|    └── openat() / connect() / sendmsg()                                       |
|          |                                                                    |
|          +---> [ SYSCALL ENTRY: tracepoint/raw_syscalls/sys_enter ] (CAUGHT!) |
|                                                                               |
|  ---------------------------------------------------------------------------  |
|                                                                               |
|  [ io_uring SQPOLL Implant ]                                                  |
|    ├── 1. One-time `io_uring_setup(entries, IORING_SETUP_SQPOLL)` at startup  |
|    ├── 2. Userspace writes `IORING_OP_OPENAT` / `IORING_OP_CONNECT` /         |
|    |      `IORING_OP_SEND` directly into mmap'd shared SQ Ring Buffer         |
|    |      (ZERO SYSCALLS ISSUED! `IOSQE_FIXED_FILE` bypasses normal fdtable!) |
|    └── 3. Kernel `iou-sqp` thread wakes up in Ring-0:                         |
|          └── `io_sq_thread()` -> `io_submit_sqes()` -> `io_issue_sqe()`       |
|                ├── Calls `do_filp_open()` / `__sys_connect_file()` directly   |
|                └── ONLY Enforceable at LSM (`security_*`) or `io_uring` TP!   |
|                                                                               |
+-------------------------------------------------------------------------------+
Worse still, implants register fixed file descriptors via IORING_REGISTER_FILES (IOSQE_FIXED_FILE), storing struct file * pointers inside an internal io_rsrc_node table rather than the process’s normal files_struct table (fdtable)—hiding open files and sockets from naive descriptor walks unless /proc/<pid>/fdinfo is inspected.
2. Hunting & Blocking Rogue io_uring Instances in Production
To close the io_uring visibility gap, you must shift your telemetry and enforcement from the syscall entry boundary down to the io_uring internal tracepoint layer and the Linux Security Module (BPF_LSM) layer.
Defense Layer 1: Restrict Unprivileged io_uring Creation (sysctl)
On Linux 6.6+ / 6.12+, kernel.io_uring_disabled controls who can instantiate a ring buffer:
0: All unprivileged processes can createio_uringinstances (Dangerous default on general-purpose hosts—exposes both rootkit evasion andio_uringlocal privilege escalation surfaces).1: Only processes within thekernel.io_uring_groupGID (or holdingCAP_SYS_ADMIN) can callio_uring_setup(2).2:io_uringdisabled system-wide, even forrootprocesses.
# Restrict io_uring creation strictly to a dedicated high-IOPS database group (GID 994)
sysctl -w kernel.io_uring_disabled=1
sysctl -w kernel.io_uring_group=994
Defense Layer 2: Live Forensics via /proc/<pid>/fdinfo & io_uring Tracepoints
Every active io_uring instance is backed by an anonymous inode file descriptor (anon_inode:[io_uring]). Even if an implant uses IORING_SETUP_SQPOLL and IOSQE_FIXED_FILE registered descriptors, the kernel’s io_uring_show_fdinfo() handler (io_uring/fdinfo.c) exposes the ring’s live head/tail counters, dedicated SqThread PID, CPU affinity, and UserFiles table directly inside /proc/[pid]/fdinfo/[fd]:
#!/usr/bin/env bash
# hunt-io-uring-implants.sh — Enumerate all processes with active io_uring rings & SQPOLL threads
set -euo pipefail

for fd_link in /proc/[0-9]*/fd/*; do
  target=$(readlink "$fd_link" 2>/dev/null || true)
  if [[ "$target" == "anon_inode:[io_uring]" ]]; then
    pid=$(echo "$fd_link" | cut -d/ -f3)
    fd=$(echo "$fd_link" | cut -d/ -f5)
    comm=$(cat "/proc/$pid/comm" 2>/dev/null || echo "unknown")
    exe=$(readlink "/proc/$pid/exe" 2>/dev/null || echo "unknown")
    echo "================================================================"
    echo "[!] ACTIVE IO_URING DETECTED: PID=$pid ($comm) FD=$fd EXE=$exe"
    grep -E "SqThread|SqThreadCpu|SqHead|SqTail|CqHead|CqTail|UserFiles" \
      "/proc/$pid/fdinfo/$fd" 2>/dev/null || true
  fi
done
To capture every SQE opcode (IORING_OP_OPENAT = 18, IORING_OP_CONNECT = 16, IORING_OP_SEND = 26, IORING_OP_SOCKET = 45, IORING_OP_URING_CMD = 46) regardless of whether it arrived via io_uring_enter() or a zero-syscall SQPOLL worker, attach bpftrace to tracepoint:io_uring:io_uring_submit_req (note: called tracepoint:io_uring:io_uring_submit_sqe on kernels prior to Linux 6.3):
# Linux 6.3+ / 6.12+: Trace all io_uring SQE opcodes submitted across the host (catches SQPOLL!)
bpftrace -e '
tracepoint:io_uring:io_uring_submit_req {
  printf("[IO_URING SQE] pid=%d comm=%s opcode=%d flags=0x%x\n",
         pid, comm, args->opcode, args->flags);
}'
3. Offensive eBPF Rootkits: bpf_probe_write_user, XDP Triggers, & sys_bpf Spoofing
What happens when the attacker uses eBPF itself as the rootkit (TripleCross, Boopkit, Symbiote)?
Modern offensive eBPF implants combine three kernel primitives:
- Userspace Return-Buffer Tampering (
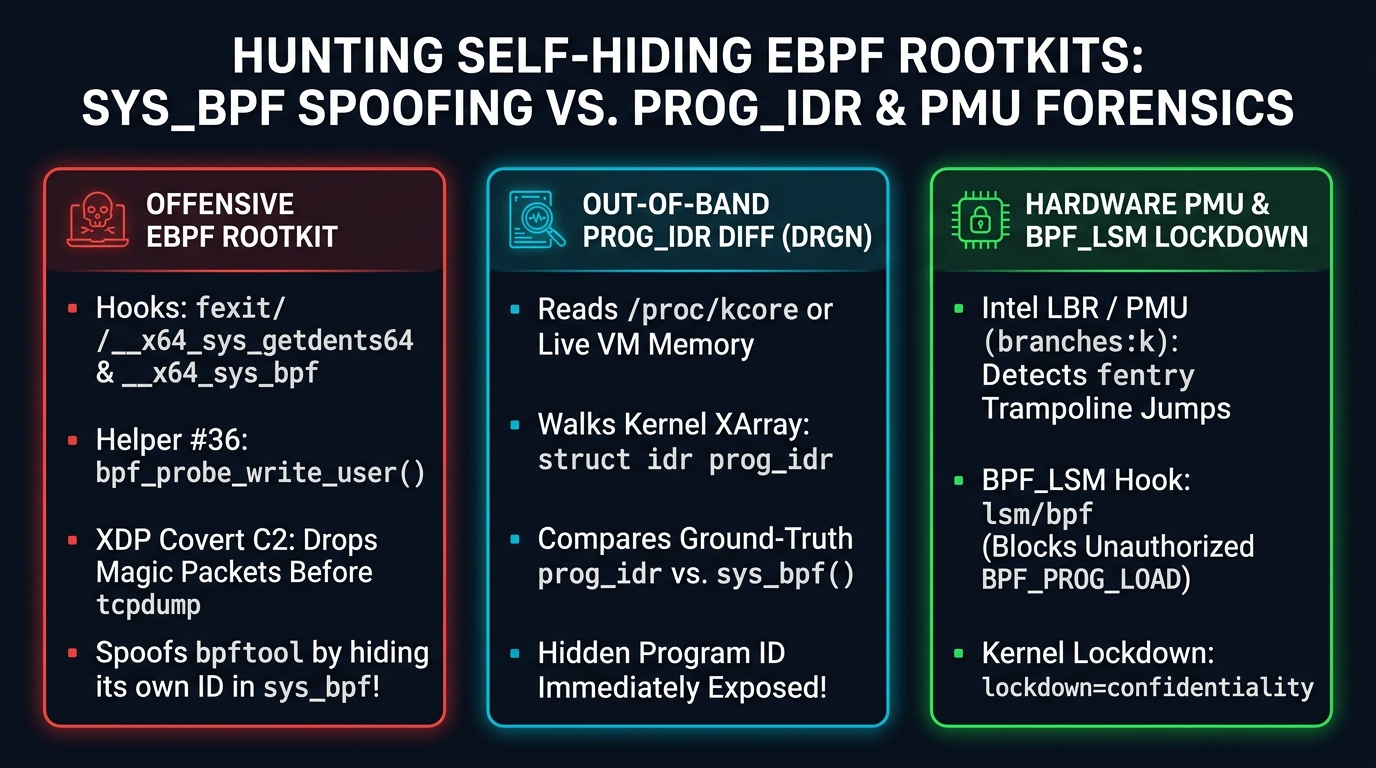
bpf_probe_write_user, Helper#36): Attached totp_btf/sys_exitorfexit/__x64_sys_getdents64, the eBPF program waits for the kernel to populate thelinux_dirent64directory listing buffer in userspace RAM, then usesbpf_probe_write_user()to add the hidden entry’sd_reclento the preceding entry—unlinking/proc/<rogue_pid>or malicious files fromps,top, andls. - Pre-Stack
XDPCovert C2 Triggers (BPF_PROG_TYPE_XDP): Attached directly to the network driver’s RX ring buffer, anXDPprogram inspects incoming raw Ethernet frames insideNET_RX_SOFTIRQbefore the kernel allocates ansk_buffor delivers the packet toAF_PACKET(tcpdump/libpcap) ornftables. When a magic TCP sequence number or encrypted UDP knock arrives, the XDP hook copies the command into a BPF ring buffer to wake a dormant userspace implant and returnsXDP_DROP—leaving zero trace in packet captures or firewall logs! - Self-Hiding via
__x64_sys_bpfSubversion: When a defender runsbpftool prog show,bpftooliterates loaded programs by callingbpf(BPF_PROG_GET_NEXT_ID, &attr, sizeof(attr)). A self-hiding eBPF rootkit attaches anfexit/__x64_sys_bpfprobe that inspectsuattr->start_id; whenever the kernel returns the rootkit’s ownprog_id, the rootkit callsbpf_probe_write_user(&uattr->next_id, &next_legit_id, sizeof(__u32))—making the rootkit completely invisible tobpftool!
4. Defeating Self-Hiding eBPF Rootkits: Out-of-Band prog_idr XArray Forensics & Hardware PMU LBR
How do you catch an eBPF rootkit that hooks __x64_sys_bpf to lie to bpftool?
You exploit a fundamental architectural boundary of the Linux eBPF verifier: bpf_probe_write_user() can only modify userspace virtual memory (access_ok() check)—it is strictly forbidden from mutating Ring-0 kernel data structures!
Inside Ring-0 (kernel/bpf/syscall.c), the kernel tracks every loaded struct bpf_prog inside a global radix-tree / XArray named prog_idr. Even if the rootkit lies to userspace syscalls, its struct bpf_prog pointer must remain inside prog_idr in kernel RAM for the kernel to manage its lifecycle and JIT execution pages.
Technique A: Direct Kernel Memory prog_idr Diffing with drgn (/proc/kcore)
Using Meta’s programmable kernel debugger drgn against live kernel memory (/proc/kcore), we can walk the Ring-0 prog_idr radix tree directly and diff those ground-truth IDs against what the bpf(BPF_PROG_GET_NEXT_ID) syscall reports to userspace:
#!/usr/bin/env drgn
# audit_hidden_bpf_prog_idr.py — Detect self-hiding eBPF rootkits by diffing
# Ring-0 `prog_idr` XArray (/proc/kcore) against userspace sys_bpf(BPF_PROG_GET_NEXT_ID)
import ctypes
import os
import drgn
from drgn.helpers.linux.idr import idr_for_each

libc = ctypes.CDLL("libc.so.6", use_errno=True)
SYS_bpf = 321  # x86_64 __NR_bpf
BPF_PROG_GET_NEXT_ID = 11

class BpfAttrGetId(ctypes.Structure):
    _fields_ = [("start_id", ctypes.c_uint32), ("next_id", ctypes.c_uint32), ("open_flags", ctypes.c_uint32)]

def get_userspace_visible_prog_ids() -> set[int]:
    """Query sys_bpf(BPF_PROG_GET_NEXT_ID) exactly as bpftool does."""
    visible = set()
    attr = BpfAttrGetId(start_id=0, next_id=0, open_flags=0)
    while libc.syscall(SYS_bpf, BPF_PROG_GET_NEXT_ID, ctypes.byref(attr), ctypes.sizeof(attr)) == 0:
        visible.add(int(attr.next_id))
        attr.start_id = attr.next_id
    return visible

# 1. Collect userspace-visible BPF program IDs (subject to fexit/__x64_sys_bpf spoofing)
user_ids = get_userspace_visible_prog_ids()

# 2. Walk the ground-truth Ring-0 `prog_idr` radix tree directly in /proc/kcore
kernel_progs: dict[int, drgn.Object] = {}
for prog_id, ptr in idr_for_each(prog["prog_idr"].address_of_()):
    bpf_p = drgn.cast("struct bpf_prog *", ptr)
    kernel_progs[int(prog_id)] = bpf_p

# 3. Any ID in Ring-0 `prog_idr` missing from `user_ids` is a self-hiding rootkit!
hidden_ids = set(kernel_progs.keys()) - user_ids
print(f"[*] Userspace sys_bpf IDs : {sorted(user_ids)}")
print(f"[*] Ring-0 prog_idr IDs   : {sorted(kernel_progs.keys())}")

if hidden_ids:
    print(f"\n[!] CRITICAL ALERT: {len(hidden_ids)} SELF-HIDING EBPF ROOTKIT(S) EXPOSED IN /proc/kcore!")
    for hid in sorted(hidden_ids):
        p = kernel_progs[hid]
        name = p.aux.name.string_().decode("utf-8", errors="replace")
        jit_addr = hex(int(p.bpf_func))
        print(f"    -> Hidden Prog ID={hid} | name='{name}' | type={int(p.type)} | jit_func={jit_addr}")
else:
    print("\n[+] Integrity verified: Ring-0 prog_idr matches userspace sys_bpf.")
Technique B: Silicon Hardware PMU Last Branch Records (Intel LBR / AMD BRS)
Whenever an eBPF fentry or fexit program attaches to a kernel function like __x64_sys_getdents64 or __x64_sys_bpf, the kernel’s text-poke engine overwrites the function’s 5-byte __fentry__ NOP prologue (0f 1f 44 00 00) with a direct callq (e8 <rel32>) jumping into a dynamically generated bpf_trampoline_* page inside the BPF JIT address region.
By programming the CPU’s silicon Performance Monitoring Unit (PMU) to capture hardware Last Branch Records (LBR) on kernel branches (branches:k), the processor’s internal MSR registers record every physical branch source and destination IP in silicon—completely out of reach of bpf_probe_write_user:
# 1. Sample silicon Last Branch Records (LBR) for all Ring-0 branches across 1 second
perf record -e branches:k -j any,k -a -- sleep 1

# 2. Inspect LBR branch stacks for jumps from core kernel .text into bpf_trampoline / bpf_prog JIT pages
perf script --fields comm,pid,brstacksym | grep -E "bpf_trampoline|bpf_prog_"
You can also cross-Verify the kernel’s ftrace / trampoline registry and dmesg taint flags using this triage script:
#!/usr/bin/env bash
# hunt-ebpf-rootkits.sh — Triage bpf_probe_write_user taints, ftrace trampolines, and xlated bytecode
set -euo pipefail

echo "[1/3] Checking kernel ring buffer for bpf_probe_write_user / bpf_override_return warnings..."
dmesg | grep -iE "bpf_probe_write_user|bpf_override_return" || echo "      No dmesg helper warnings found."

echo "[2/3] Auditing /sys/kernel/tracing/enabled_functions for active BPF trampolines (F/M flags)..."
grep -E "bpf_trampoline|__x64_sys_(getdents|bpf|read)" /sys/kernel/tracing/enabled_functions 2>/dev/null || true

echo "[3/3] Scanning visible BPF bytecode for Helper #36 (bpf_probe_write_user) & Helper #58 (bpf_override_return)..."
for id in $(bpftool prog show --json | jq -r '.[].id'); do
  if bpftool prog dump xlated id "$id" 2>/dev/null | grep -qE "bpf_probe_write_user|bpf_override_return|helper call (36|58)"; then
    echo "❌ CRITICAL ALERT: BPF Program ID $id invokes memory/return-tampering helper!"
    bpftool prog show id "$id"
  fi
done
5. Preventive Lockdown: Blocking Rogue BPF_PROG_LOAD & SQPOLL with BPF_LSM
Detection is essential, but preventing an attacker (even one who achieves uid=0 root inside a container or host service) from loading unauthorized eBPF programs or spawning io_uring SQPOLL threads is the ultimate defense.
Attach a signed BPF_LSM policy to lsm/bpf and lsm/uring_sqpoll at early boot, and seal the host with Linux Kernel Lockdown (lockdown=confidentiality):
// SPDX-License-Identifier: GPL-2.0
#include "vmlinux.h"
#include <bpf/bpf_helpers.h>
#include <bpf/bpf_tracing.h>
#include <errno.h>

char LICENSE[] SEC("license") = "GPL";

// Map of allowed BPF loader binary inode numbers (populated at boot before lockdown)
struct {
    __uint(type, BPF_MAP_TYPE_HASH);
    __uint(max_entries, 32);
    __type(key, __u64);
    __type(value, __u8);
} trusted_bpf_loaders SEC(".maps");

// 1. Block ANY unapproved process (even root!) from calling bpf(BPF_PROG_LOAD)
SEC("lsm/bpf")
int BPF_PROG(restrict_bpf_load, int cmd, union bpf_attr *attr, unsigned int size)
{
    if (cmd != BPF_PROG_LOAD)
        return 0;

    struct task_struct *task = (struct task_struct *)bpf_get_current_task_btf();
    struct file *exe = task->mm ? task->mm->exe_file : NULL;
    if (!exe || !exe->f_inode)
        return -EPERM;

    __u64 ino = exe->f_inode->i_ino;
    if (!bpf_map_lookup_elem(&trusted_bpf_loaders, &ino)) {
        bpf_printk("BPF_LSM BLOCKED rogue BPF_PROG_LOAD from pid=%d ino=%llu\n",
                   task->pid, ino);
        return -EPERM;
    }
    return 0;
}

// 2. Block io_uring IORING_SETUP_SQPOLL kernel thread creation system-wide
SEC("lsm/uring_sqpoll")
int BPF_PROG(block_uring_sqpoll, int ret)
{
    return -EPERM;
}
When paired with sysctl kernel.unprivileged_bpf_disabled=1, sysctl kernel.io_uring_disabled=1, and lockdown=confidentiality (which disables bpf_probe_write_user() at the kernel verifier level and blocks /dev/mem / unsigned kexec), even a full root compromise cannot blind your kernel telemetry or spin up invisible Ring-0 rootkits.
Interactive io_uring SQPOLL, Self-Hiding eBPF `sys_bpf` & Hardware PMU Rootkit Hunter
Simulate syscall-less `io_uring` `SQPOLL` implants, `fexit/__x64_sys_bpf` program-ID spoofing, and pre-stack `XDP_DROP` C2 triggers against legacy `sys_enter` EDRs, `/proc/kcore` `prog_idr` XArray walking (`drgn`), and Intel LBR hardware PMU branch telemetry.
1. io_uring SQPOLL Syscall-Less Implant
After a single `io_uring_setup(entries, IORING_SETUP_SQPOLL)` call at startup, the implant writes `IORING_OP_OPENAT`, `IORING_OP_CONNECT`, and `IORING_OP_SEND` SQEs directly into shared userspace RAM. The kernel `iou-sqp` thread drains and executes them in Ring-0 without a single `syscall` instruction.
`tracepoint/raw_syscalls/sys_enter` and `auditd` never fire because no `syscall` instruction is executed for `openat`, `connect`, or `send`.
`bpftool` only inspects eBPF programs, not `anon_inode:[io_uring]` descriptors (requires `/proc/<pid>/fdinfo` inspection).
`tracepoint:io_uring:io_uring_submit_req` fires inside `io_submit_sqes()` for every SQE opcode even under `SQPOLL`!
`SEC("lsm/uring_sqpoll")` blocks `SQPOLL` thread creation outright (`-EPERM`), and `lsm/socket_connect` intercepts the C2 socket inside `io_connect()`.
Walking `task->files->fdt` or `/proc/[pid]/fdinfo` exposes `anon_inode:[io_uring]` and active `SqThread` PIDs.
Hardware PMU (`branches:k`) records kernel branch edges through `io_sq_thread -> io_issue_sqe` on the dedicated polling core.
// ABOUT THE AUTHOR
Joshua Edward McLaughlin Cox
Technomancer & Systems ArchitectPassionate about low-level Linux systems engineering, high-scale Kubernetes deployments, local artificial intelligence pipelines, and defensive security. Building robust, sovereign computing environments that stand the test of time.